

With this type of maths problem, you are going to have a polynomial, exponential, logarithmic or trigonometric equation. Studying a function consists of studying its changes and limits; finding extremes and asymptotes (if there are any!), and finally graphing the equation. So with that in mind, and all the skills you can practice, it's a question that comes up pretty much every year as far as exams are concerned. As you can imagine, mastering these skills will also serve you well when you learn maths. Take this example of a function: 


Differentiating a Function
The function f(x) is a polynomial function formed of 3 terms. Here's a crash course in differentiation for you... 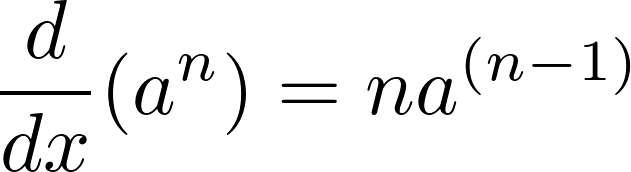

Factorising a Derivative
The aim of this step is to try and make our derivative as simple as possible - but factorising it isn't always possible. Don't forget to factorise where you can, as it helps you massively later. You may be familiar with factorisation from our previous articles on solving equations! If you take a look at the derivative above, you should see that each term has a factor of three within it. With this in mind, let's simplify our expression: 


Studying Graphs of Derivatives
We can figure out some properties of the graph before drawing it, just by analysing the equation itself.

One of our parentheses is (x+3). From this, we know that if our value of y is 0, then our graph will intersect the x axis at -3. If x is greater than -3, the y intercept is negative. If x is less than -3, the y intercept is positive. Conversely, the other set of parentheses is (x-1). So the opposite applies: if x is greater than 1, then the y intercept is positive. If x is less than 1, then the y intercept is negative. Returning to our original equation, for a moment, there's a theorem that states the following...
A local minimum or maximum point exists for a function where the derivative of that function is equal to 0.
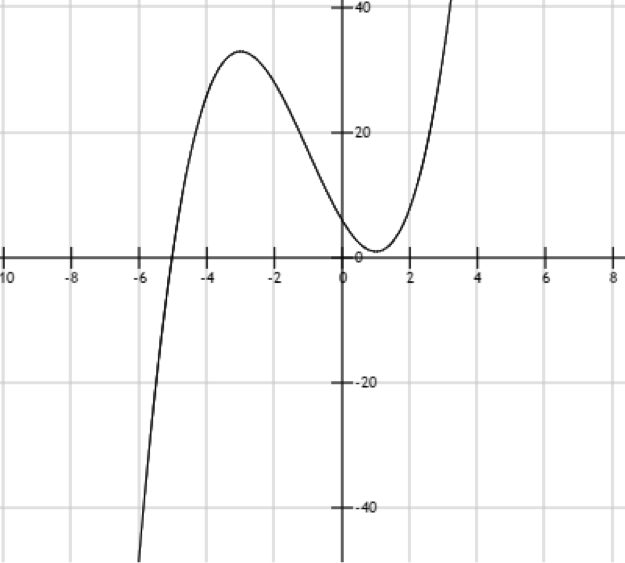
We've just identified that our derivative is equal to 0 at x = -3 and x = 1. To find the point where a maximum or minimum point exists on our function, sub these values into the original function to find their equivalent y coordinates. That gives you: (-3, 33) and (1, 1). So now the question is: which point is a maximum point, and which is a minimum point? One way is to just sketch out the graph, and it should quickly become obvious, another is to look at the coordinates themselves: 33 is clearly greater than 1, so this would be the maximum point. Find different online maths tutor here.
Drawing a Graph
Great! So now we've used the derivative to calculate the maximum and minimum points of our function. The final step is to sketch out the graph. To do so, first mark your maximum and minimum points on the graph. We know the line must pass through both of these points, although we may be a little unsure of its shape. You may already know the general shape for a trinomial equation, but either way, the safest method is to pick some other points before, inbetween, and after, your minimum and maximum points, and then essentially connect the dots up. We chose the following values:
- x -> f(x)
- -5 -> 1
- -2 -> 28
- -1 -> 17
- 0 -> 6
- 5 -> 161
Now we have some dots to connect up between the maximum and minimum points, we can sketch the graph itself:
Summing Up
This was basic maths help for studying functions to draw graphs. There are some "gotchas" we didn't cover here, although they're unlikely to come up too often in an exam. One such example would be if there are breaks in the function itself. If you had some trouble following this post, panic not! This is a topic covered at SSC and HSC, and isn't too applicable to CBSE students - although it can't hurt to have some extra knowledge! In fact there are many unsolved maths equations. You could also consider looking into a private tutor to solidify your knowledge of maths problems. You can find one right now on SuperProf!
Summarise with AI:
Did you like this article? Leave a rating!

 Loading...