R is among the most widely used scripting languages for statistical programming. Since the early 2010s, the need for R programmers has been steadily increasing, and R continues to be the preferred programming language among data scientists. These days, R has also been deep learning-adapted, making it easier for many statisticians to use deep learning in their respective domains. It has made R an essential component of the current developing AI landscape.

Why You Should Learn R
Linear regression, time series, statistical inference, linear and non-linear modeling, classification, clustering, machine learning algorithms, and many more statistical and graphical techniques are included in R. R also has excellent capabilities for visualization, reporting, and interactivity, which are essential for both the business and data science fields. The icing on the cake is that R has packages for various business-related areas, including finance and econometrics. R is a fantastic choice for data scientists, developers, and entrepreneurs.
By Statisticians, for Statisticians

R is a statistical program. R is the go-to language for any statistical analysis, from identifying straightforward measures of central tendency to creating intricate statistical models.
The tool is open-source.
R is a completely free programming language because it is open-source. In addition to being able to install it on your computer freely, you may also update, alter, and copy it. Additionally, as R is distributed under the GNU license, you can redistribute and sell it (General Public License).
It is cross-platform compatible.
Yes, R can run on various operating systems with various software and hardware requirements. R can run seamlessly on any operating system using Windows, Mac, or Linux. Additionally, it can easily import data from Oracle, MySQL, SQLite, and Microsoft Excel.
It has an extensive library.
R has a large library of built-in packages and functions that are intended to meet a variety of applications, as we have said. It includes specialized programs for tasks like Imputation, Machine Learning, Statistical Modeling, Data Manipulation, and Data Visualization. You can also create your package and contribute to the R community because R is open-source.
It has a massive community.
A sizable community of engaged developers, coders, and data scientists supports R. So, you may rest confident that if you ever find yourself stuck or unable to solve a problem, you can always ask for assistance from the R community. Not only that, but you may also collaborate on projects and engage in idea exchange with other professionals.
It is fantastic for visualizing.
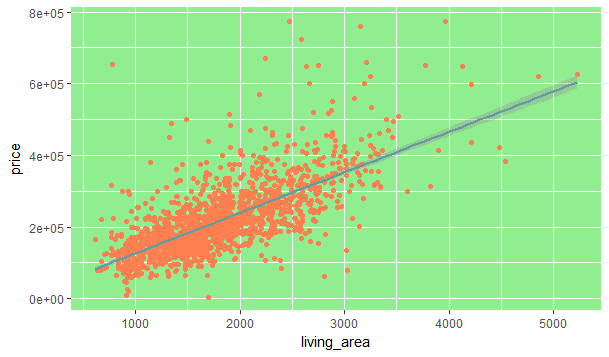
R provides some best-in-class tools for building complex visualizations like ggplot2, lattice, leaflet, plotly, and RGL, to mention a few. These tools allow you to create excellent graphs.
Varied Industrial Uses
R programming is used in banking to create econometric models and examine fraudulent transactions. The telecom industry uses R programming for subscriber profiling, churn management, and targeted advertising. Genomic analysis in computational biology is carried out using R programming.
Interactive Web Apps
Ever pondered the possibility of using your data analysis software to create beautiful web applications? Shiny is a package that R offers specifically for that purpose. Shiny enables you to construct stunning dashboard designs and interactive web pages from your R Console.
Advanced R Programming Courses in 2023

R can be learned without prior programming experience in 4-6 weeks. It just takes approximately two weeks for people with programming experience. The time it takes to learn R will rely on your prior programming experience, commitment to learning, access to the correct tools, level of digital literacy, and your exposure to coding projects.
Data Analysis with R Programming (Google)
This free-to-audit course equips you with the skills needed to apply for entry-level jobs as a data analyst through hands-on practice. You’ll learn the ins and outs of the R programming language such that you can clean, organize, analyze, visualize, and report data by using the powerful R tools and packages in RStudio.
The course begins with an overview of the R programming language (and programming in general). You’ll write your code in RStudio, a powerful coding environment, and be amazed at how R can perform virtually any task in every phase of the data analysis process.
You’ll start by exploring the fundamental concepts associated with R, most notably data structures like vectors, lists, matrices, and data frames. R is fundamentally all about manipulating data and must be contained in data structures. And to manipulate them, you’ll need to learn the inbuilt functions and popular R packages.
Before you start analyzing data, you’ll need to clean it to ensure it is mostly error-free. R provides an arsenal of tools in the form of packages, the most popular package being the Tidyverse package. As part of the Tidyverse, you’ll have access to the functions in tidyr to help you check for missing values and statistical anomalies. Tidyverse also provides ggplot, a powerful and customizable data visualization library with all sorts of features.
R has several options to explore when you are ready to save and present your analysis. R Markdown is a file format for making dynamic documents with R. You’ll end the course by learning how to format and export R Markdown and incorporate R code chunks in your documents.
The course is five weeks long, with 37 hours worth of material in the form of video lectures, readings, and assignments. For paying learners, each week ends with a graded quiz, and the final week contains a course challenge that will ask you questions about the key skills you’ve practiced throughout the course.
Data Analysis with R (Facebook)
Data Analysis with R by Facebook gives a comprehensive (but not basic) introduction to R programming. As stated in the course name, the emphasis in this course is on exploratory data analysis (EDA). EDA explores data through statistical methods and background information to better understand the data you’re working with.
By the end of the course, you’ll be able to confidently investigate and summarize datasets using R and even create your analysis to find hidden patterns! Although the course recommends some background in statistics (like in Intro to Descriptive Statistics from Udacity), it is not required. Also, no programming experience is needed.
Unfortunately, most of the data you’ll receive as a data analyst will be raw and unfiltered. To ensure that you’re not wasting time and effort working on faulty datasets, you’ll need to inspect the dataset thoroughly for any sign of anomalies and outliers in data. The course teaches you the tools to explore one variable with histograms and boxplots, two with scatter plots and correlations, and even more variables by adding colors and shapes to your graph.
Finally, the course wraps up by going through a diamond data set. You’ll see how everything you’ve learned in this course is put into practice to help you understand the importance of following the data analytic workflow and knowing your tools well.
This course runs for eight weeks and is split into ten lessons, with the final project being the final project. You’ll learn from the video lectures supplied in the course and the plenty of embedded exercises in Udacity. The final project consists of you creating your own exploratory data analysis on a data set of your choice to help you consolidate what you’ve learned.
Data Science and Machine Learning Bootcamp with R (Udemy)
Made for beginners and established developers, Data Science and Machine Learning Bootcamp with R starts you off with the basics of R programming. You’ll slowly build your knowledge of machine learning through hands-on R programming exercises up to the point where you can do your data science project. The course focuses on three main topics: R programming, machine learning, and data visualization.
The course consists of 35 sections with 18 hours worth of material. It contains a boatload of videos and exercises in the form of interactive notebooks (with solutions) for you to practice coding. Additionally, you’ll complete multiple machine-learning projects throughout the course.

The Analytics Edge (Massachusetts Institute of Technology)
MIT’s The Analytics Edge is for any aspiring data analyst who wants a rigorous understanding of analytical methods and R programming. The contents of this course mirror its corresponding MIT on-campus class, so expect it to be challenging (but rewarding)!
By the end of this course, you’ll have an applied understanding of many different analytics methods, including linear regression, logistic regression, CART, clustering, and data visualization. Additionally, you’ll have the programming skills to implement all of these methods in R. To take this course, you’ll need high-school mathematical knowledge of things like mean, standard deviation, and scatter plots. No prior programming experience is required.
The course begins with an introduction to analytics and the R programming language, a statistical modeling language. Data analytics plays a huge role in business and technological affairs, like Moneyball, eHarmony, the Framingham Heart Study, Twitter, IBM Watson, and Netflix. You’ll encounter each of these case studies throughout your study of the course.
You’ll start with a discussion of linear regression and logistic regression. They may be one of the simplest analytical methods, but don’t underestimate their potential! Sometimes, an analytical model may be unclear on why it predicts one thing over another. Classification and regression trees aren’t like this and are very interpretable. You’ll learn how trees can be applied in the Supreme Court and health care cost prediction. Additionally, you’ll cover the field of text analytics, an exciting application of statistical methods where words are analyzed for opinion and intelligence.
You’ll learn about clustering — grouping similar data points together. This may seem simple, but such algorithms are used on YouTube and Amazon to recommend personalized content to people. Then, you’ll unravel the power of visualization for understanding worldwide trends and communicating insights and ideas. You’ll also discuss the concept of predictive policing, which uses analytics to stop crime. Finally, you’ll study linear, and integer optimization techniques, which help airlines offer the best discounts and sports league design their schedules.


