

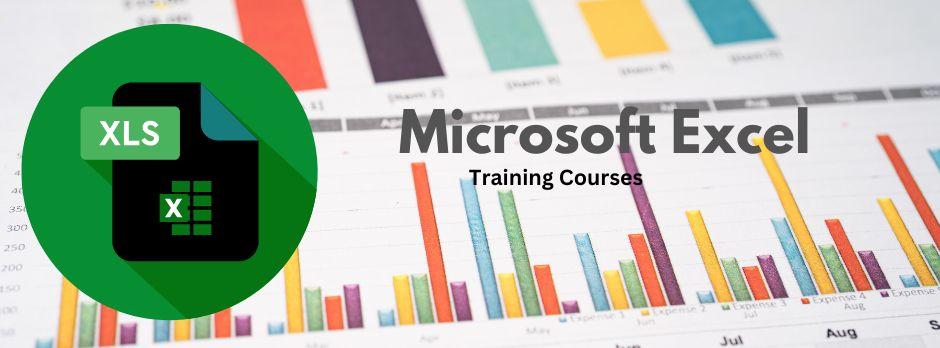
Microsoft Excel is a cornerstone tool for managing data, creating reports, and performing calculations. Mastering basic Excel formulas is essential whether you’re new to Excel or looking to refine your skills. This guide explores key MS Excel formulas and functions, offers Microsoft Excel tips using AI, and emphasizes the value of MS Excel training to enhance productivity.


Understanding MS Excel Formulas and Functions
Excel formulas are the foundation of calculations in a worksheet. They always begin with an equal sign (=) and can include mathematical operations, cell references, and other elements. For example, =A1+A2 add the values in cells A1 and A2. Formulas allow for dynamic updates; if the data in the referenced cells changes, the formula's result updates automatically.
Excel functions are pre-programmed shortcuts that perform specific operations, such as summing numbers, finding averages, or performing logical tests. Functions simplify complex tasks, often requiring just a few inputs to deliver powerful results. For instance, the SUM function can add an entire range of values (=SUM(A1:A10)), making it faster and less error-prone than manually adding each cell.
Why Learn Formulas and Functions?
Learning MS Excel formulas and functions equips users to handle data efficiently, saving hours of manual effort. They allow you to automate calculations, reduce errors, and unlock insights hidden in raw data. From small business owners managing inventory to analysts handling large datasets, these tools offer flexibility and precision.
By understanding these basic concepts, you create a solid foundation for more advanced Excel skills, enabling smoother workflows and more accurate results. Whether you're calculating expenses, analyzing trends, or generating reports, Excel’s formulas and functions are essential tools for productivity.
Why MS Excel Training is Essential
Learning MS Excel formulas and functions on your own can be overwhelming without guidance. Structured MS Excel training simplifies the process, helping you build confidence and proficiency. Training sessions often focus on practical scenarios where formulas and functions streamline tasks, such as:
- Budget management
- Inventory tracking
- Performance analysis
Online courses and tutorials offer flexible options for mastering basic Excel formulas at your own pace. With proper training, you can effectively use Excel’s features and enhance decision-making.
How MS Excel Training Can Drive Career Growth
Investing in MS Excel training can significantly enhance your career prospects. Proficiency in MS Excel formulas and functions is a highly valued skill across industries, enabling professionals to manage data effectively, make informed decisions, and automate tasks.
For example, in finance, knowing how to use formulas like VLOOKUP, IF, and SUMIFS helps analyze budgets and forecast trends with precision. Employers prioritize candidates who can create dynamic dashboards to summarize performance metrics or track sales data. Similarly, marketing professionals often use Excel to analyze campaign ROI, leveraging PivotTables and data visualization techniques to present insights.
In project management, Excel training equips you with tools to allocate resources, manage timelines, and track project progress efficiently. Mastering functions like COUNTIF or INDEX/MATCH can streamline reporting, making you a valuable asset to your team.
Moreover, certifications like the Microsoft Office Specialist (MOS) Excel certification validate your skills, boosting your resume. Such credentials demonstrate your ability to handle complex data analysis tasks, increasing your chances of career advancement. Whether you’re an entry-level employee or a manager, Excel proficiency empowers you to work smarter, improving both individual and organizational performance.
Build a solid tech foundation alongside Excel with coding classes on Superprof.
Practical Applications of MS Excel Formulas and Functions
The versatility of MS Excel formulas and functions makes them invaluable across industries. The table below highlights practical applications in various fields:
| Industry | Use Case | Key Excel Formulas and Functions | Additional Tools or Features |
| Business & Finance | Financial analysis, budgeting, expense tracking | SUM, AVERAGE, IF, VLOOKUP, PMT for loan calculations; and COUNTIF for data segmentation | PivotTables for financial summaries, Conditional Formatting for expense tracking |
| Education | Grade calculation, attendance tracking, and performance analysis | AVERAGE, MAX, MIN, IF, COUNTIF for student assessment and attendance trends | Charts for visualizing performance, Data Validation for consistent input |
| Marketing | Campaign performance tracking, ROI calculations | SUMIF, AVERAGEIF, TEXT for formatting campaign dates; and CONCAT to merge campaign details | Forecast Sheets for trend predictions, Sparklines for visual metrics |
| Human Resources | Employee data management, payroll calculations | VLOOKUP for retrieving employee information; SUMIFS for salary aggregations; and DATEDIF to calculate tenure | Data Validation for dropdowns, Conditional Formatting to flag anomalies |
| Sales | Sales performance tracking, forecasting | FORECAST, TREND, IF, INDEX/MATCH for flexible data lookups; and TEXT for custom sales report formatting | Dashboards for visual summaries, Power Query for data cleaning |
| Healthcare | Patient record management, resource allocation | COUNTIF for tracking patient counts; SUM for calculating resource usage; and IF for condition-based reporting | AI-powered Ideas for spotting trends, Charts for patient demographics |
| Supply Chain | Inventory management, demand forecasting | SUM, IFERROR, VLOOKUP for product tracking; and FORECAST for predicting stock levels | Solver for optimization problems, Power Pivot for complex analyses |
| Project Management | Timeline tracking, resource allocation, and progress reporting | GANTT charts with Conditional Formatting; IF, TODAY for deadline tracking; and COUNTIF for task updates | Timeline Templates, Macros for repetitive tasks |
| Customer Service | Complaint tracking, response time analysis | COUNTIF for categorizing issues; AVERAGEIF for analyzing response times; and IF for priority classifications | KPI Dashboards, Conditional Formatting for urgency levels |
| Manufacturing | Production planning, quality control | IF, SUMIFS, COUNTIFS for tracking defects or material usage | Scatter Plots for defect trends, Solver for production optimization |
Why Practical Knowledge Matters
Knowing how to apply MS Excel formulas and functions to specific scenarios not only boosts efficiency but also positions professionals as problem-solvers. For instance, using VLOOKUP in HR to pull employee data instantly saves hours of manual work. Similarly, a marketer analyzing campaign performance with AVERAGEIF ensures quick and accurate decision-making. Excel’s adaptability ensures its relevance in nearly every professional domain.
Microsoft Excel Tips Using AI
Artificial Intelligence (AI) in Microsoft Excel revolutionizes how users work with data by automating tasks, generating insights, and reducing manual effort. These AI-powered tools simplify complex workflows, even for beginners. Here are some key ways AI enhances Excel usage:
- Leverage Excel Ideas for Quick Insights: The "Ideas" feature in Excel uses AI to analyze your data and surface patterns, trends, and outliers. For instance, if you have sales data spanning several months, Ideas can instantly highlight which products or regions performed best. It eliminates the need to manually create PivotTables or charts, saving time while providing actionable insights.
- Predictive Analysis with Forecast Sheets: Excel’s AI-driven Forecast Sheet allows users to project future trends based on historical data. This is especially useful in sales or inventory management, where you need to anticipate demand. By selecting your data and letting Excel apply predictive algorithms, you can create accurate projections in seconds.
- AI-Enhanced Formula Suggestions: AI now assists users by recommending formulas based on the context of their data. For example, if you’re calculating monthly averages, Excel might suggest using the
AVERAGEfunction. This is particularly helpful for those new to basic Excel formulas or when working with unfamiliar datasets. - Data Cleaning with Power Query: Power Query, powered by AI, automates tedious data cleaning tasks such as removing duplicates, filling gaps, or standardizing formats. Instead of spending hours preparing data for analysis, Power Query streamlines the process, allowing users to focus on extracting insights.
- Error Detection in Formulas: Excel’s AI highlights potential errors in formulas, such as missing arguments or mismatched data types. This proactive approach ensures accurate calculations and eliminates the frustration of troubleshooting.
Combining Basic Excel Formulas with AI for Smarter Workflows
Integrating basic Excel formulas with AI-powered features unlocks smarter, more efficient workflows. Here's how you can combine these tools:
- Data Cleaning with Power Query: AI-driven Power Query automates the tedious task of cleaning and transforming data. For instance, you can use Power Query to remove duplicates or format large datasets, saving hours of manual work. Pair this with formulas such as
TRIMto tidy up text entries orIFERRORto handle errors seamlessly. - Dynamic Analysis with PivotTables: Use PivotTables to summarize data dynamically while leveraging formulas like
SUMandCOUNTfor aggregation. AI enhances this by recommending optimal PivotTable structures based on your dataset, ensuring accurate insights without extensive setup. - Error-Free Calculations with AI Suggestions; Excel’s AI suggests the most suitable formulas for your task, reducing errors and helping beginners confidently use functions like
VLOOKUP,AVERAGE, orIF. - Automated Insights with Ideas: The Ideas feature provides instant analytics powered by AI, identifying trends or outliers without needing complex formulas. For example, it can flag an unexpected dip in sales figures within seconds.
- Predictive Analysis for Planning: Combine AI-powered Forecast Sheets with formulas such as
TRENDto predict sales, inventory needs, or resource demands. This enables data-driven decision-making with minimal effort. - Task Automation with Macros: Use recorded Macros for repetitive tasks while incorporating AI-driven formula suggestions to refine processes. Automating workflows like data entry and formatting ensures consistency.
Advanced Excel Techniques for Better Results
After mastering basic Excel formulas, advancing your knowledge of Excel functions and tools can elevate your efficiency and analytical capabilities. These advanced techniques allow for more precise data handling and enhanced decision-making.
- INDEX and MATCH for Flexible Lookups: Replacing
VLOOKUPwith the combination ofINDEXandMATCHprovides greater flexibility in data retrieval. UnlikeVLOOKUP, these functions don’t rely on data being sorted in a specific way.- Syntax for
INDEX:=INDEX(array, row_num, [column_num]) - Syntax for
MATCH:=MATCH(lookup_value, lookup_array, [match_type])
For example, useINDEXandMATCHto retrieve product details from a large dataset, even if the data structure changes.
- Syntax for
- TEXT for Custom Formatting: The
TEXTfunction allows you to format numbers, dates, and text in specific ways.- Syntax:
=TEXT(value, format_text)
For instance, format 20231206 as “06-Dec-2023” using=TEXT(A1, "DD-MMM-YYYY"). This is especially useful for reports requiring consistent date and number formats.
- Syntax:
- Power Query for Data Preparation: Power Query is an advanced tool for transforming and preparing data. Automate repetitive tasks like merging datasets or cleaning inconsistent data entries without complex formulas. For instance, you can consolidate multiple sheets of sales data with just a few clicks.
- Conditional Formatting for Visual Insights: Highlight patterns and trends by applying conditional formatting based on custom rules. For example, highlight cells with profits above 20% or tasks nearing deadlines to prioritize actions.
- Macros for Task Automation: Macros automate repetitive tasks like formatting reports or importing data. Record a macro once and replay it as needed, saving time and ensuring consistency.
Support your Excel learning with flexible online coding classes on Superprof.

Unlocking the Power of MS Excel Formulas
Mastering MS Excel formulas and functions is a transformative skill that goes beyond mere data entry. It enables users to analyze, interpret, and present data with clarity and efficiency. From learning basic Excel formulas like SUM and IF to exploring advanced techniques such as INDEX/MATCH or Power Query, Excel offers unparalleled versatility for handling diverse tasks across industries.
In today’s data-driven world, Excel proficiency is not just an asset—it’s often a requirement. Professionals in finance, marketing, education, and even healthcare depend on Excel to solve problems, forecast trends, and make informed decisions. Tools like AI-powered suggestions and Predictive Analytics further enhance the capabilities of Excel, enabling users to unlock insights faster than ever before.
Structured training programs build confidence, while certifications like Microsoft’s MOS validate your expertise, setting you apart in the job market. As industries increasingly adopt technology to streamline operations, knowing how to combine Excel’s manual functions with AI-driven tools positions you as a valuable asset.
Whether you’re a beginner or an experienced user, Excel is a skill you’ll rely on throughout your career. Embrace its potential to boost productivity, save time, and make impactful contributions.
Summarise with AI:
Did you like this article? Leave a rating!


